Chapter 22 Scattermatrix
22.1 Intro
A scattermatrix combines multiple scatterplots to allow quick visual inspection of bivariate associations between variables.
22.1.1 Example dataset
This example uses the Rosetta Stats example dataset “pp15” (see Chapter 1 for information about the datasets and Chapter 3 for an explanation of how to load datasets).
22.1.2 Variable(s)
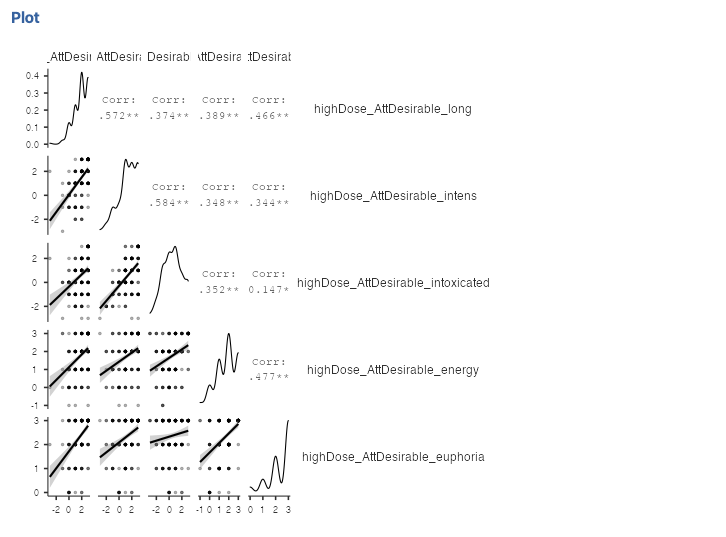
From this dataset, this example uses variables highDose_AttDesirable_long, highDose_AttDesirable_intens, highDose_AttDesirable_intoxicated, highDose_AttDesirable_energy, and highDose_AttDesirable_euphoria; these are a number of expressions of which effects people prefer when using MDMA (see Chapter 1).
22.2 Input: jamovi
In jamovi, use the ‘Regression’ menu, choose ‘Correlation matrix’, and select the variables you want to include. Then, check the checkbox at ‘Correlation Matrix’.
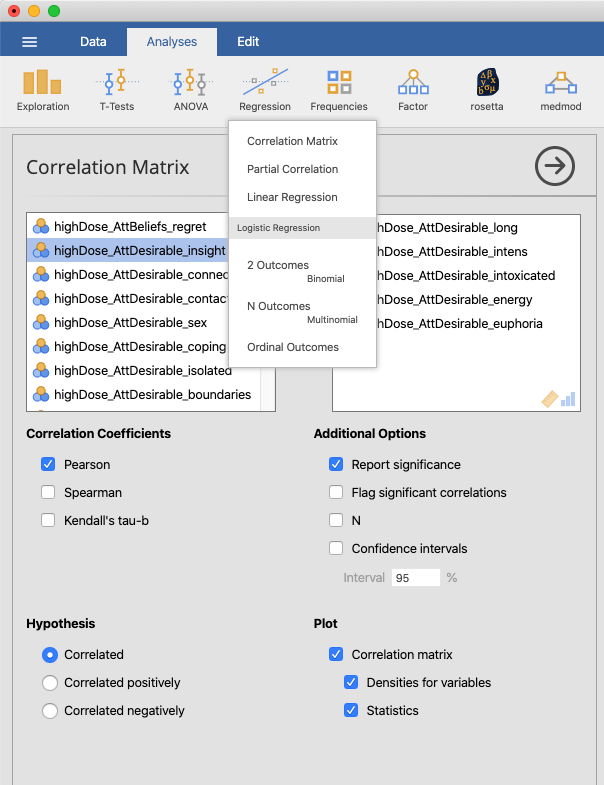
Figure 22.1: Opening the “Regression” menu in jamovi
You can also check the checkboxes at ‘Densities for variables’ and ‘Statistics’ to also include the densities on the diagonal and the point estimates in the upper triangle.
22.3 Input: R
Many analyses can be done with base R without installing additional packages. The rosetta package accompanies this book and aims to provide output similar to jamovi and SPSS with simple commands.
22.3.1 R: base R
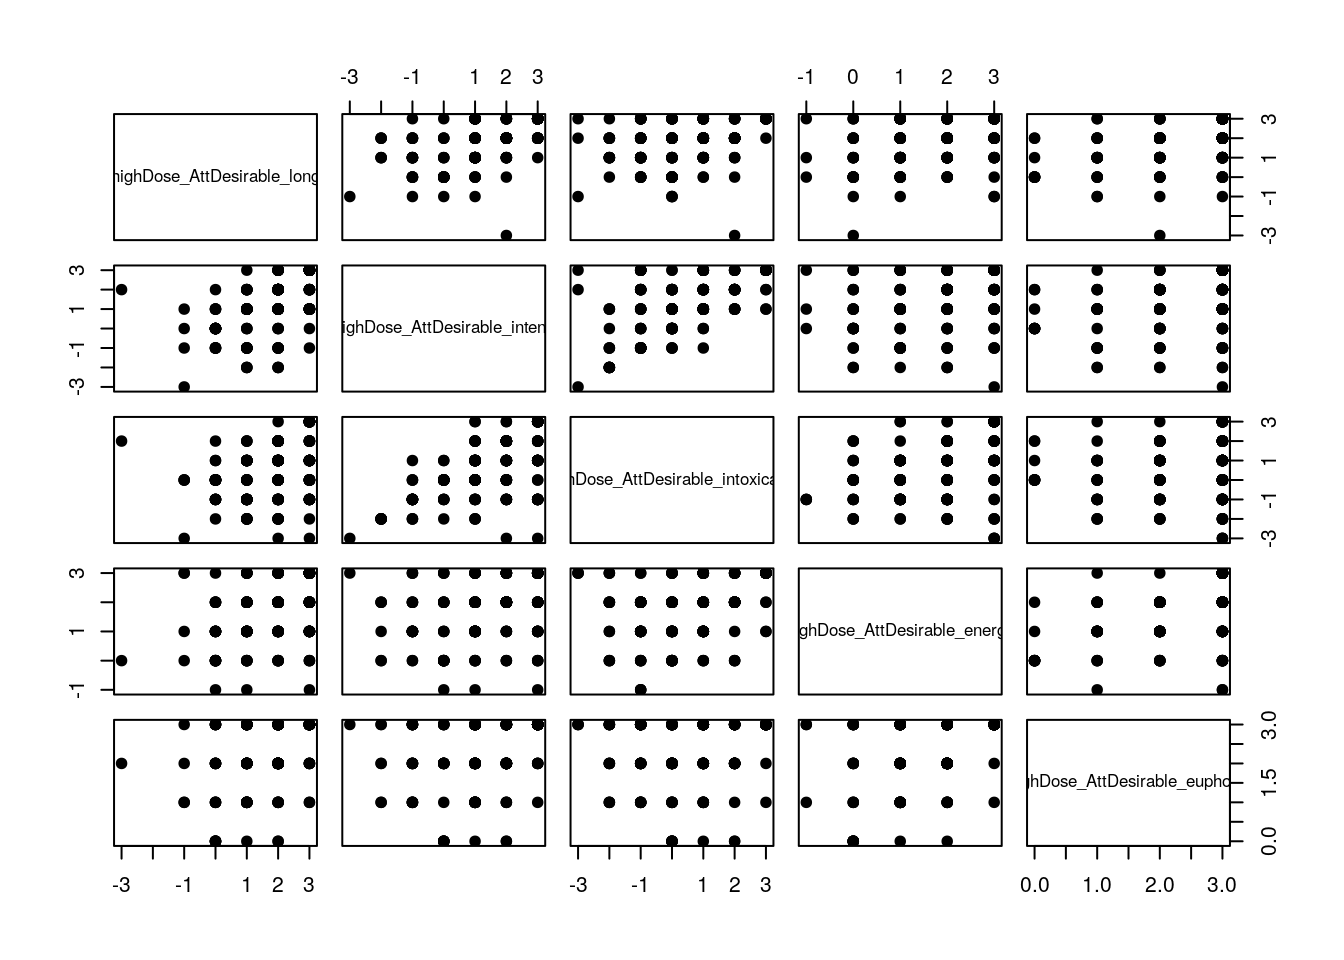
A basic scattermatrix can be produced with pairs(), specifying the used symbol by passing a number as argument pch (the default is, an open circle; see this R manual page for the full list).
pairs(
dat[
,
c(
'highDose_AttDesirable_long',
'highDose_AttDesirable_intens',
'highDose_AttDesirable_intoxicated',
'highDose_AttDesirable_energy',
'highDose_AttDesirable_euphoria'
)
],
pch = 19
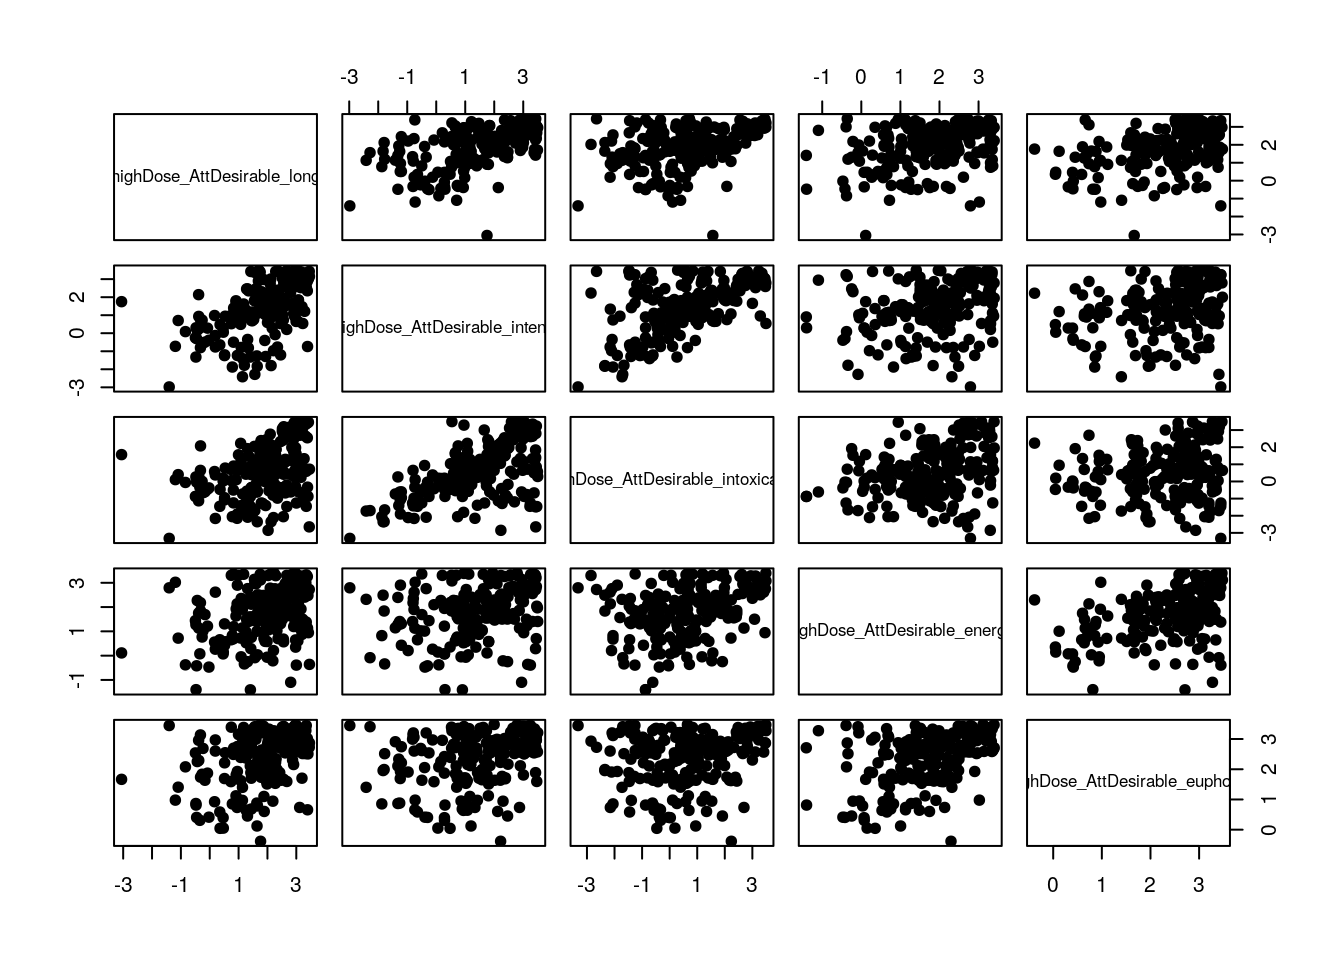
);Often, points end up overlapping, like in this case. In that situation, the data can be ‘jittered’. In this example, we will do this manually, first, and then use the jittered data in the call to pairs() (as opposed to integrating both commands into one, more efficient, but more complex statement).
jitteredDat <-
  sapply(
    dat[
      ,
      c(
        'highDose_AttDesirable_long',
        'highDose_AttDesirable_intens',
        'highDose_AttDesirable_intoxicated',
        'highDose_AttDesirable_energy',
        'highDose_AttDesirable_euphoria'
      )
    ],
    jitter,
    amount = .5
  );

pairs(
  jitteredDat,
  pch = 19
);
22.3.2 R: rosetta (ufs)
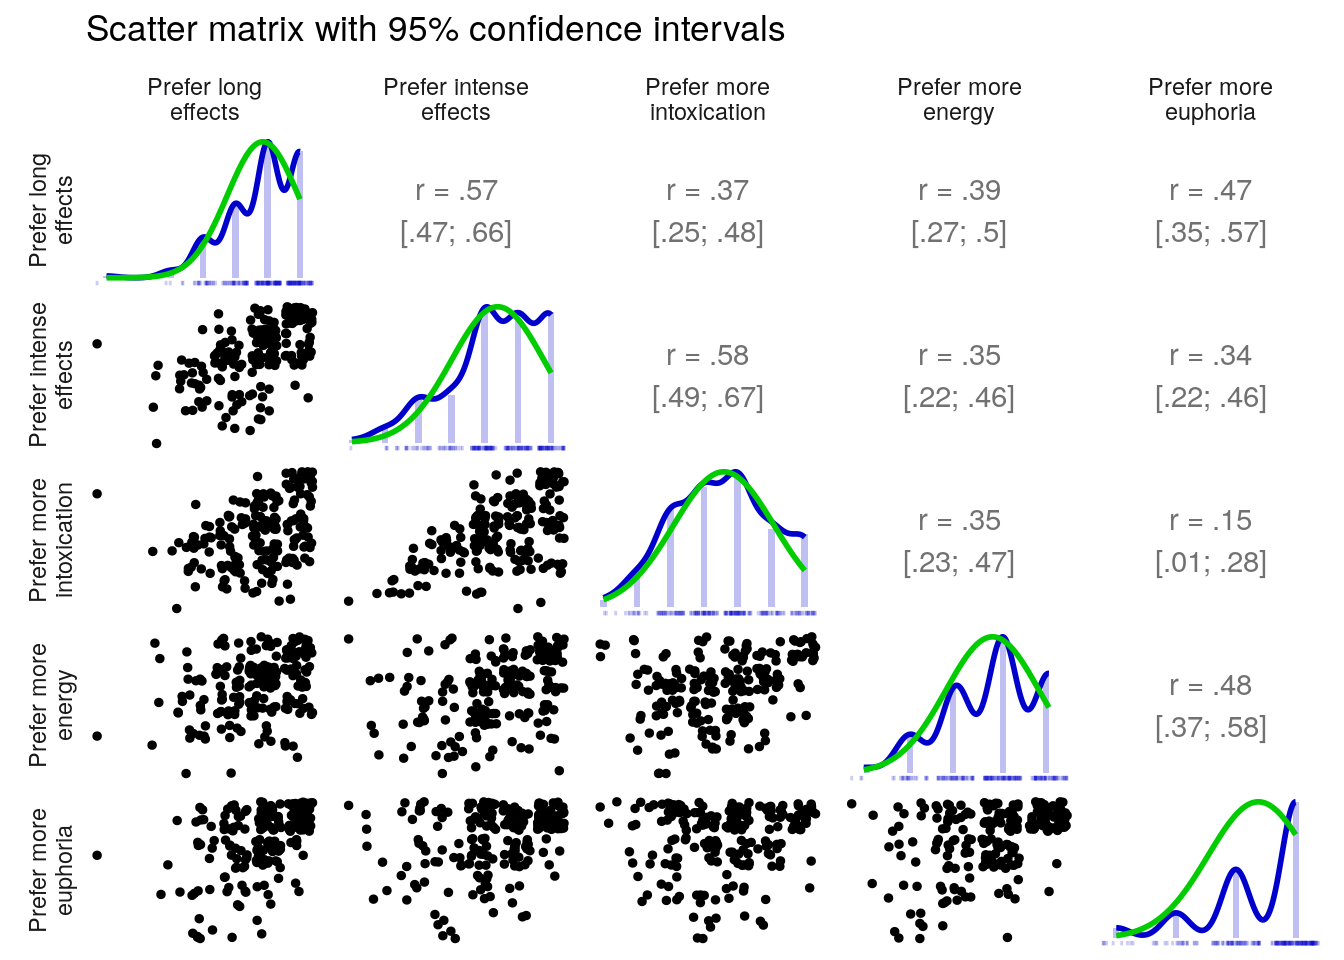
A scatter matrix function has not yet been made available in the rosetta package, but it is available in the ufs package that comes installed with rosetta. Therefore, if you have rosetta installed, you can use the following command.
ufs::scatterMatrix(
  dat,
  items = c(
    'highDose_AttDesirable_long',
    'highDose_AttDesirable_intens',
    'highDose_AttDesirable_intoxicated',
    'highDose_AttDesirable_energy',
    'highDose_AttDesirable_euphoria'
  )
);
This function always has jittering turned on, and always produces correlation confidence intervals and point estimates. The itemLabels argument can optionally be used to specify “pretty” item labels.
22.4 Input: SPSS
For SPSS, there are two approaches: using the Graphical User Interface (GUI) or specify an analysis script, which in SPSS are called “syntax”.
22.4.1 SPSS: GUI
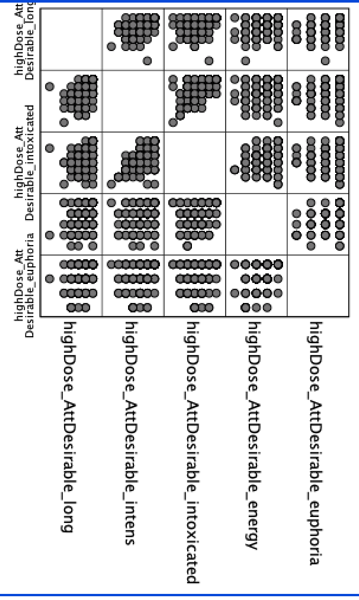
Click the “Graphs” menu; then select the “Legacy Dialogs” submenu, and then select “Scatter/Dot”. Select the “Matrix Scatter” option, and then specify the variables you’re interested in.
Alternatively, Open SPSS’ Chart Builder. Then, in the ‘Chart Types’ section, select the ‘Scatterplot matrix’ chart type. Then you can select the variables you want to include.
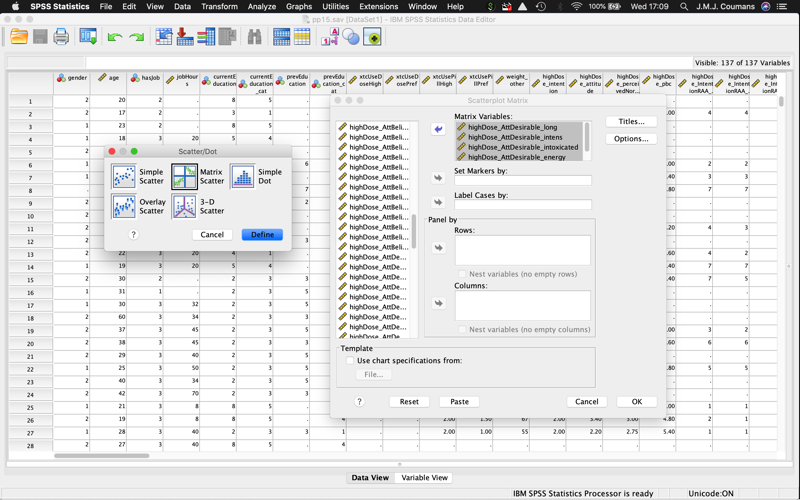
Figure 22.3: Opening the scattermatrix menu
22.4.2 SPSS: Syntax
GRAPH
  /SCATTERPLOT(MATRIX)=
    highDose_AttDesirable_long
    highDose_AttDesirable_intens
    highDose_AttDesirable_intoxicated
    highDose_AttDesirable_energy
    highDose_AttDesirable_euphoria
    WITH
    highDose_AttDesirable_long
    highDose_AttDesirable_intens
    highDose_AttDesirable_intoxicated
    highDose_AttDesirable_energy
    highDose_AttDesirable_euphoria
.
22.8 Read more
If you would like more background on this topic, you can read more in these sources:
- More options for creating scattermatrices in R are available here: http://www.sthda.com/english/wiki/scatter-plot-matrices-r-base-graphs