Chapter 10 Box plot
10.1 Intro
Boxplots are normally used to inspect the distribution of continuous (cardinal, e.g. interval or ratio-level) variables.
10.2 Input: jamovi
Open the “Exploration” menu and select the “Descriptives” option as shown in Figure 10.1.
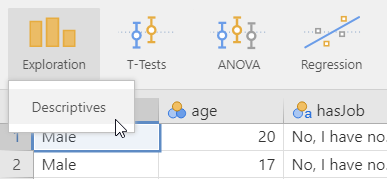
Figure 10.1: Opening the “Exploration” menu in jamovi.
In the “Descriptives” dialog that appears, expand the “Plots” section at the bottom and check the checkbox labelled “Box plot” as shown in Figure 10.2.
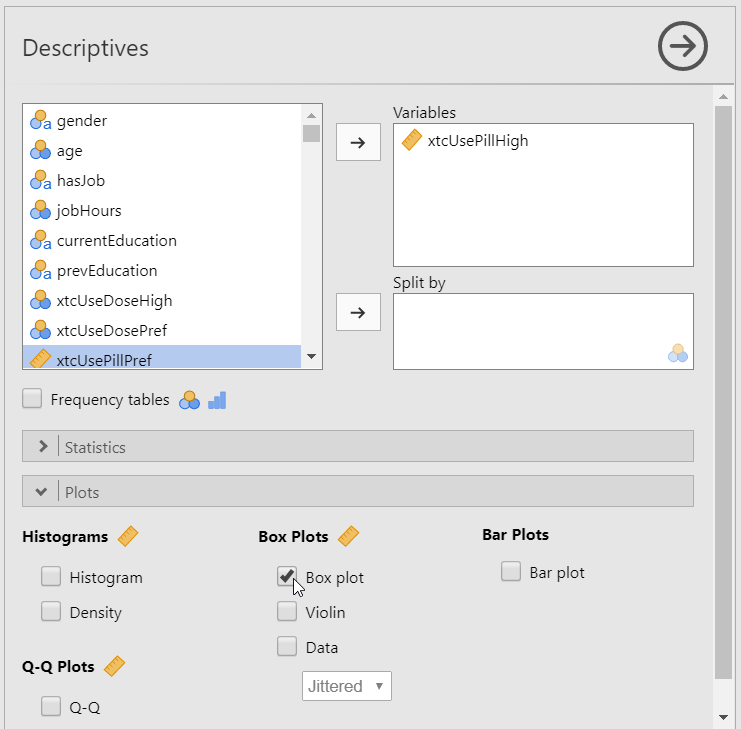
Figure 10.2: Specifying the options in the jamovi “Descriptives” dialog.
Select the variable(s) for which you want to produce a box plot by dragging those variables from the list at the top left to the box marked “Variables” just to the right of that list. The box plot will be automatically produced in the output pane on the right-hand side.
10.3 Input: R
10.3.1 R: rosetta
This requires the rosetta package to be installed, see section 2.3.2, and the example dataset to be stored under name dat, see section 3.
rosetta::ggBoxplot(dat$xtcUsePillHigh);10.3.2 R: base
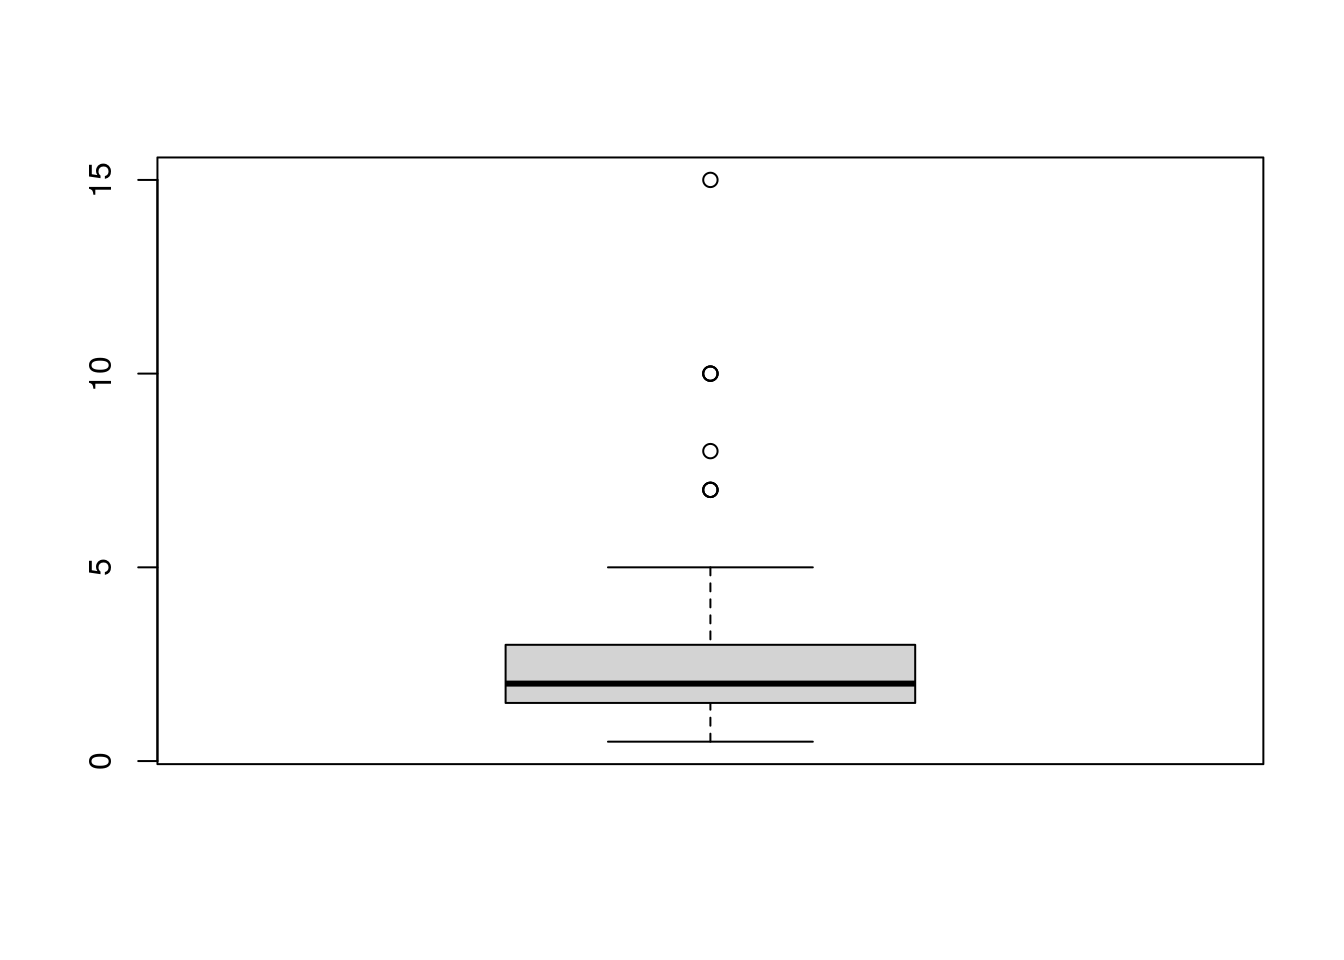
This requires the example dataset to be stored under name dat, see section 3.
boxplot(dat$xtcUsePillHigh);10.4 Input: SPSS
10.4.1 SPSS: GUI
First activate the dat dataset by clicking on it (see 2.4.1).
Open the “Graphs” menu and select the “Chart Builder” option as shown in Figure 10.3.
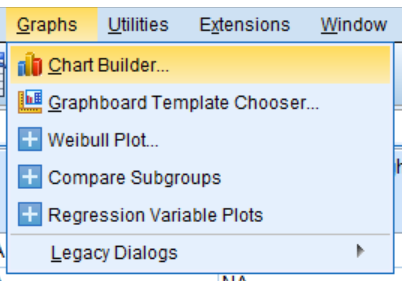
Figure 10.3: Opening the “Chart Builder” option in SPSS.
In the “Chart Builder” dialog, select “Boxplot” from “Gallery” and drag “1-D Boxplot” to the “Chart Preview” as shown in Figure 10.4.
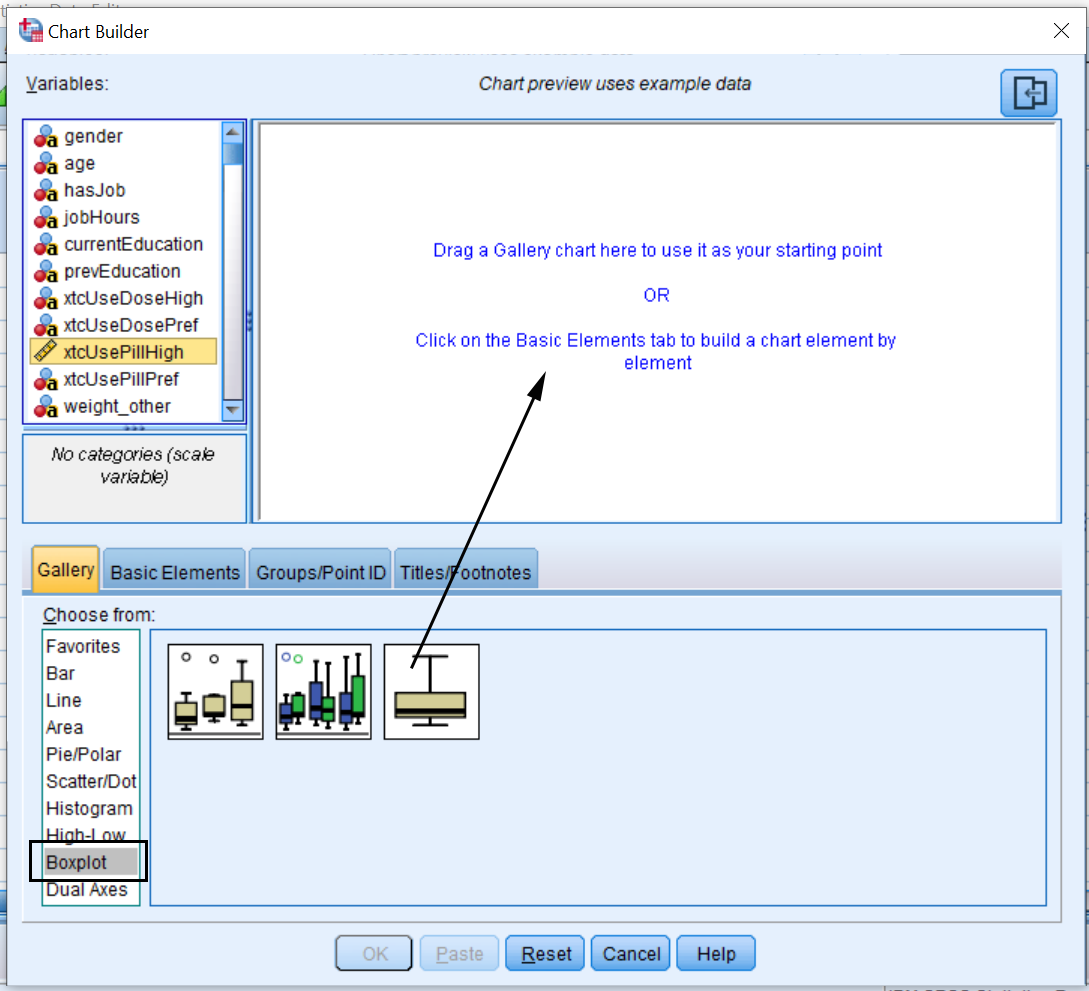
Figure 10.4: Selecting Box Plot from the Chart Builder in SPSS.
Under the “Variables” menu, select “xtcUsePillHigh” and drag it onto the “X-Axis?” option in “Chart Preview” as shown in Figure 10.5. The variable you put on the vertical x-axis must be labeled as “scale” type. Note that there are options to modify the aesthetics of the graph on the right side of the screen under “Element Properties”, “Chart Appearance”, and “Options”.
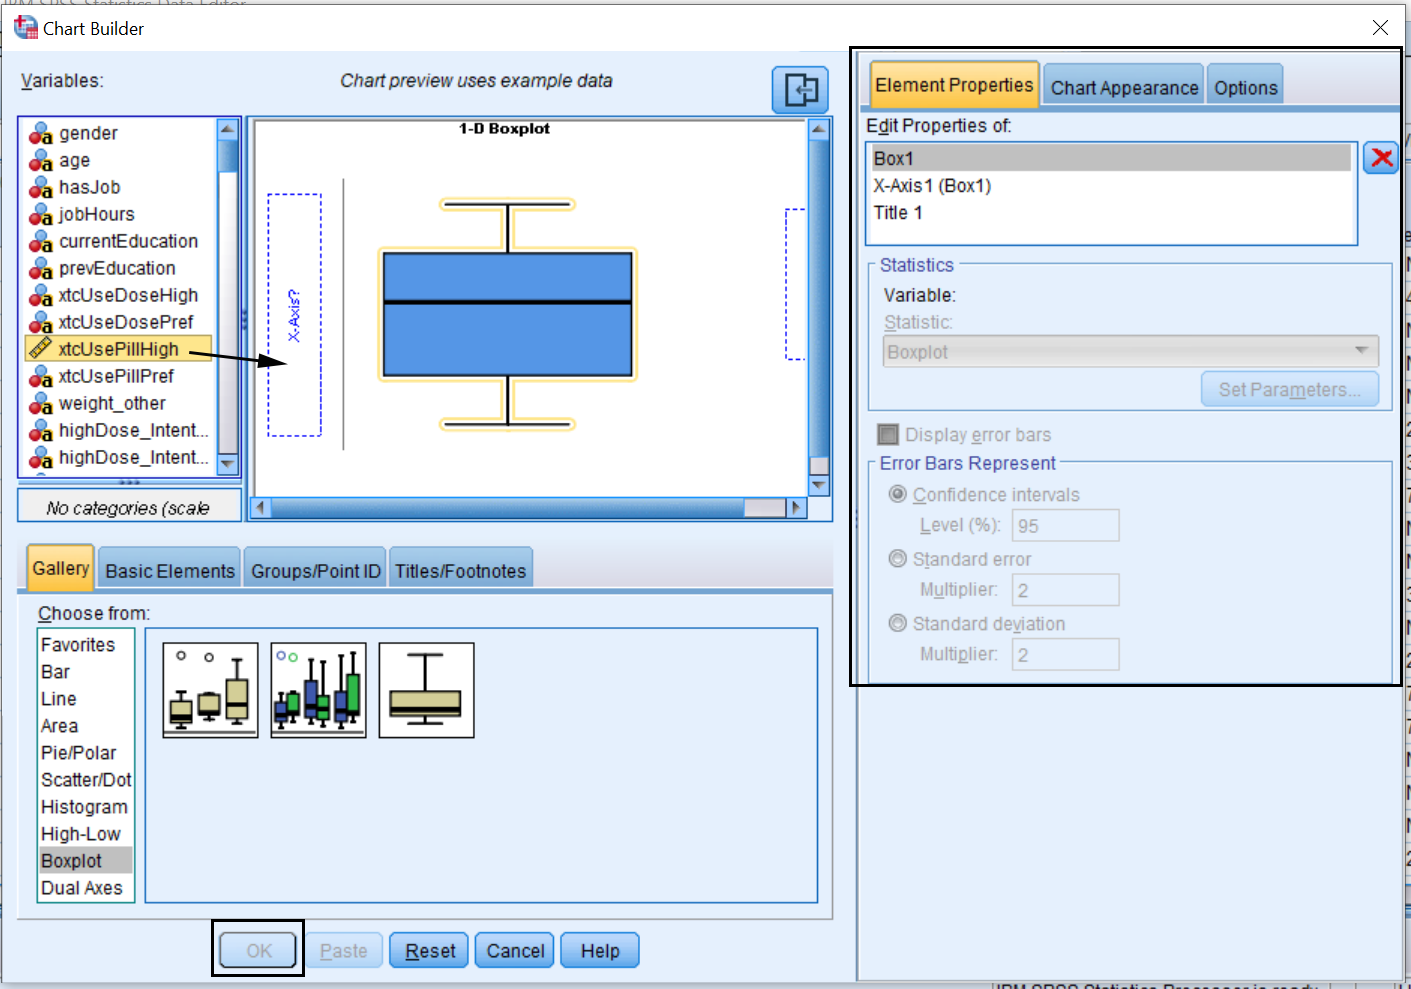
Figure 10.5: Adding the variable to the box plot in SPSS.
Press OK and the graph will appear in the SPSS output window.
10.4.2 SPSS: Syntax
Use the following command (this requires the dat dataset to be the active dataset, see 2.4.1):
GRAPH /BOXPLOT = xtcUsePillHigh.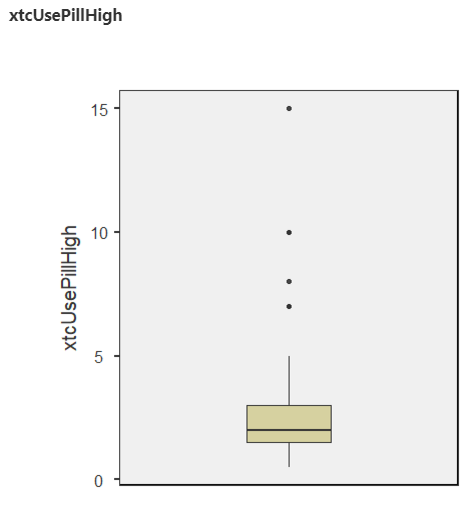
10.8 Read more
If you would like more background on this topic, you can read more in these sources:
- Discovering Statistics with SPSS (closed access):
- Learning Statistics with R (Navarro 2018): section 6.5, page 175 (or follow this link for the Bookdown version)